Materials
Materials Testing and Fundamental Properties
The Chemical or Ladle analysis and the Mechanical Tests. Of these tests one of the most important is the Tensile Test. As this allows us to quantify the material properties.
|
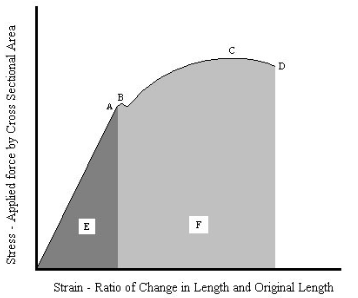
- The Applied Load or Force, - The Change in Length or Strain due to the applied load, - The Cross-Sectional Area as the load is applied, - The Maximum Load applied to the test piece, - The failure point and the above data at this point. - The Stress σ = Force (N) / Area (m²) - The Strain ε = Δlength (m) / Length (m) - The Poisson's Ratio v = -ε_trans (m) /ε_axial (m). - The Limit of Proportionality 'A' on the graph. - The Yield Point, or 0.2% Proof Stress 'B' on the graph. - The Ultimate Tensile Strength (UTS) 'C' on the graph. - The Fracture Strength 'D' on the graph. - The Elastic Region, area 'E' on the graph. - The Plastic Region, areas 'F' on the graph. |  |
| The Material Properties.. |
|---|
-
- Tensile or Young's Modulus (E) Pa = Stress σ / Strain ε ; The gradient of the proportional part of the curve up to point 'A'.
- Shear Modulus or Modulus of Rigidity (G) Pa = Young's Modulus 'E' / (2 x (1 + Poisson's Ratio 'v'))
- Toughness or Modulus of Resiliance (U) J/m³:
- = Yield Strength σy x Yield Strain εy / 2; or
= Yield Strength σy² / 2 x Young's Modulus (E);
This is the total area under the curve 'E'+'F'
| The Tensile and Shear Strength Relationship. |
|---|
Remember, this is a guide and requires Engineering Judgement to decide if this applies. It does not apply to Non Ductile materials such as Ceramics or Glass. It is also only a relationship between yield strengths. Once beyond the limit of proportionality these models and others fall down. |
| The Hardness and Tensile Strength Relationship. |
Young's Modulus (E) MPa = e ((Shore D + 50) x 0.0235 - 0.6403). |
| Shore Hardness to Young's Modulus Calculator | |||
|---|---|---|---|
| Shore Hardness (A/D): | - | ||
| Young's Modulus (E): | MPa |